上一篇文章,PHP 7.1安装xhprof进行性能分析,讲述了xhprof linux情况下的安装,接下来说说xhprof再tp5下面的应用。
ThinkPHP中的行为是一个比较抽象的概念,你可以把行为想象成在应用执行过程中的一个动作。
如果你还不了解thinkphp的钩子和行为,可以参考手册:https://www.kancloud.cn/manual/thinkphp5_1/354129
首先,我们在application/tags.php文件中,定义性能分析的行为,分别绑定在app_init、app_initApp初始化标和应用结束的钩子上:
<?php
// +----------------------------------------------------------------------
// | ThinkPHP [ WE CAN DO IT JUST THINK ]
// +----------------------------------------------------------------------
// | Copyright (c) 2006~2016 http://thinkphp.cn All rights reserved.
// +----------------------------------------------------------------------
// | Licensed ( http://www.apache.org/licenses/LICENSE-2.0 )
// +----------------------------------------------------------------------
// | Author: liu21st <liu21st@gmail.com>
// +----------------------------------------------------------------------

// 应用行为扩展定义文件
return [
    // 应用初始化
    'app_init'     => ["app\common\behavior\XhprofStart"],
    // 应用开始
    'app_begin'    => [],
    // 模块初始化
    'module_init'  => [],
    // 操作开始执行
    'action_begin' => [],
    // 视图内容过滤
    'view_filter'  => [],
    // 日志写入
    'log_write'    => [],
    // 应用结束
    'app_end'      => ["app\common\behavior\XhprofEnd"],
];
创建开始分析行为:
application/common/behavior/XhprofStart.php
<?php
namespace app\common\behavior;

/**
 * 开始性能分析
 */
class XhprofStart
{
    public function run($params)
    {
        xhprof_enable(XHPROF_FLAGS_NO_BUILTINS | XHPROF_FLAGS_CPU | XHPROF_FLAGS_MEMORY);
    }
}
创建性能分析结束行为:
application/common/behavior/XhprofEnd.php
<?php

namespace app\common\behavior;

/**
 * 结束性能分析
 */
class XhprofEnd
{
    public function run($params)
    {
        if (isset($_REQUEST['xhprof'])) {
            //stop profiler
            $xhprof_data = xhprof_disable();

            //冲刷(flush)所有响应的数据给客户端,结合log记录调试使用,不输出到客户端
//            if (function_exists('fastcgi_finish_request')) {
//            fastcgi_finish_request();
//            }

            // xhprof的目录
            include_once EXTEND_PATH . "/xhprof/xhprof_lib/utils/xhprof_lib.php";
            include_once EXTEND_PATH . "/xhprof/xhprof_lib/utils/xhprof_runs.php";

            $xhprof_runs = new \XHProfRuns_Default();

            // save the run under a namespace "xhprof_foo"
            $run_id = $xhprof_runs->save_run($xhprof_data, "xhprof_foo");


            echo '<a href="' . config('xhprof_url') . '/index.php?run=' . $run_id . '&source=xhprof_foo" target="_blank">性能分析</a>';die;
        }

    }
}
graphviz是一个绘制图形的工具,可以更为直观的让你查看性能的瓶颈。
wget http://www.graphviz.org/pub/graphviz/stable/SOURCES/graphviz-2.24.0.tar.gz
cd graphviz-2.24.0
./configure
make && make install
或者yum直接安装
yum install libpng
yum install graphviz
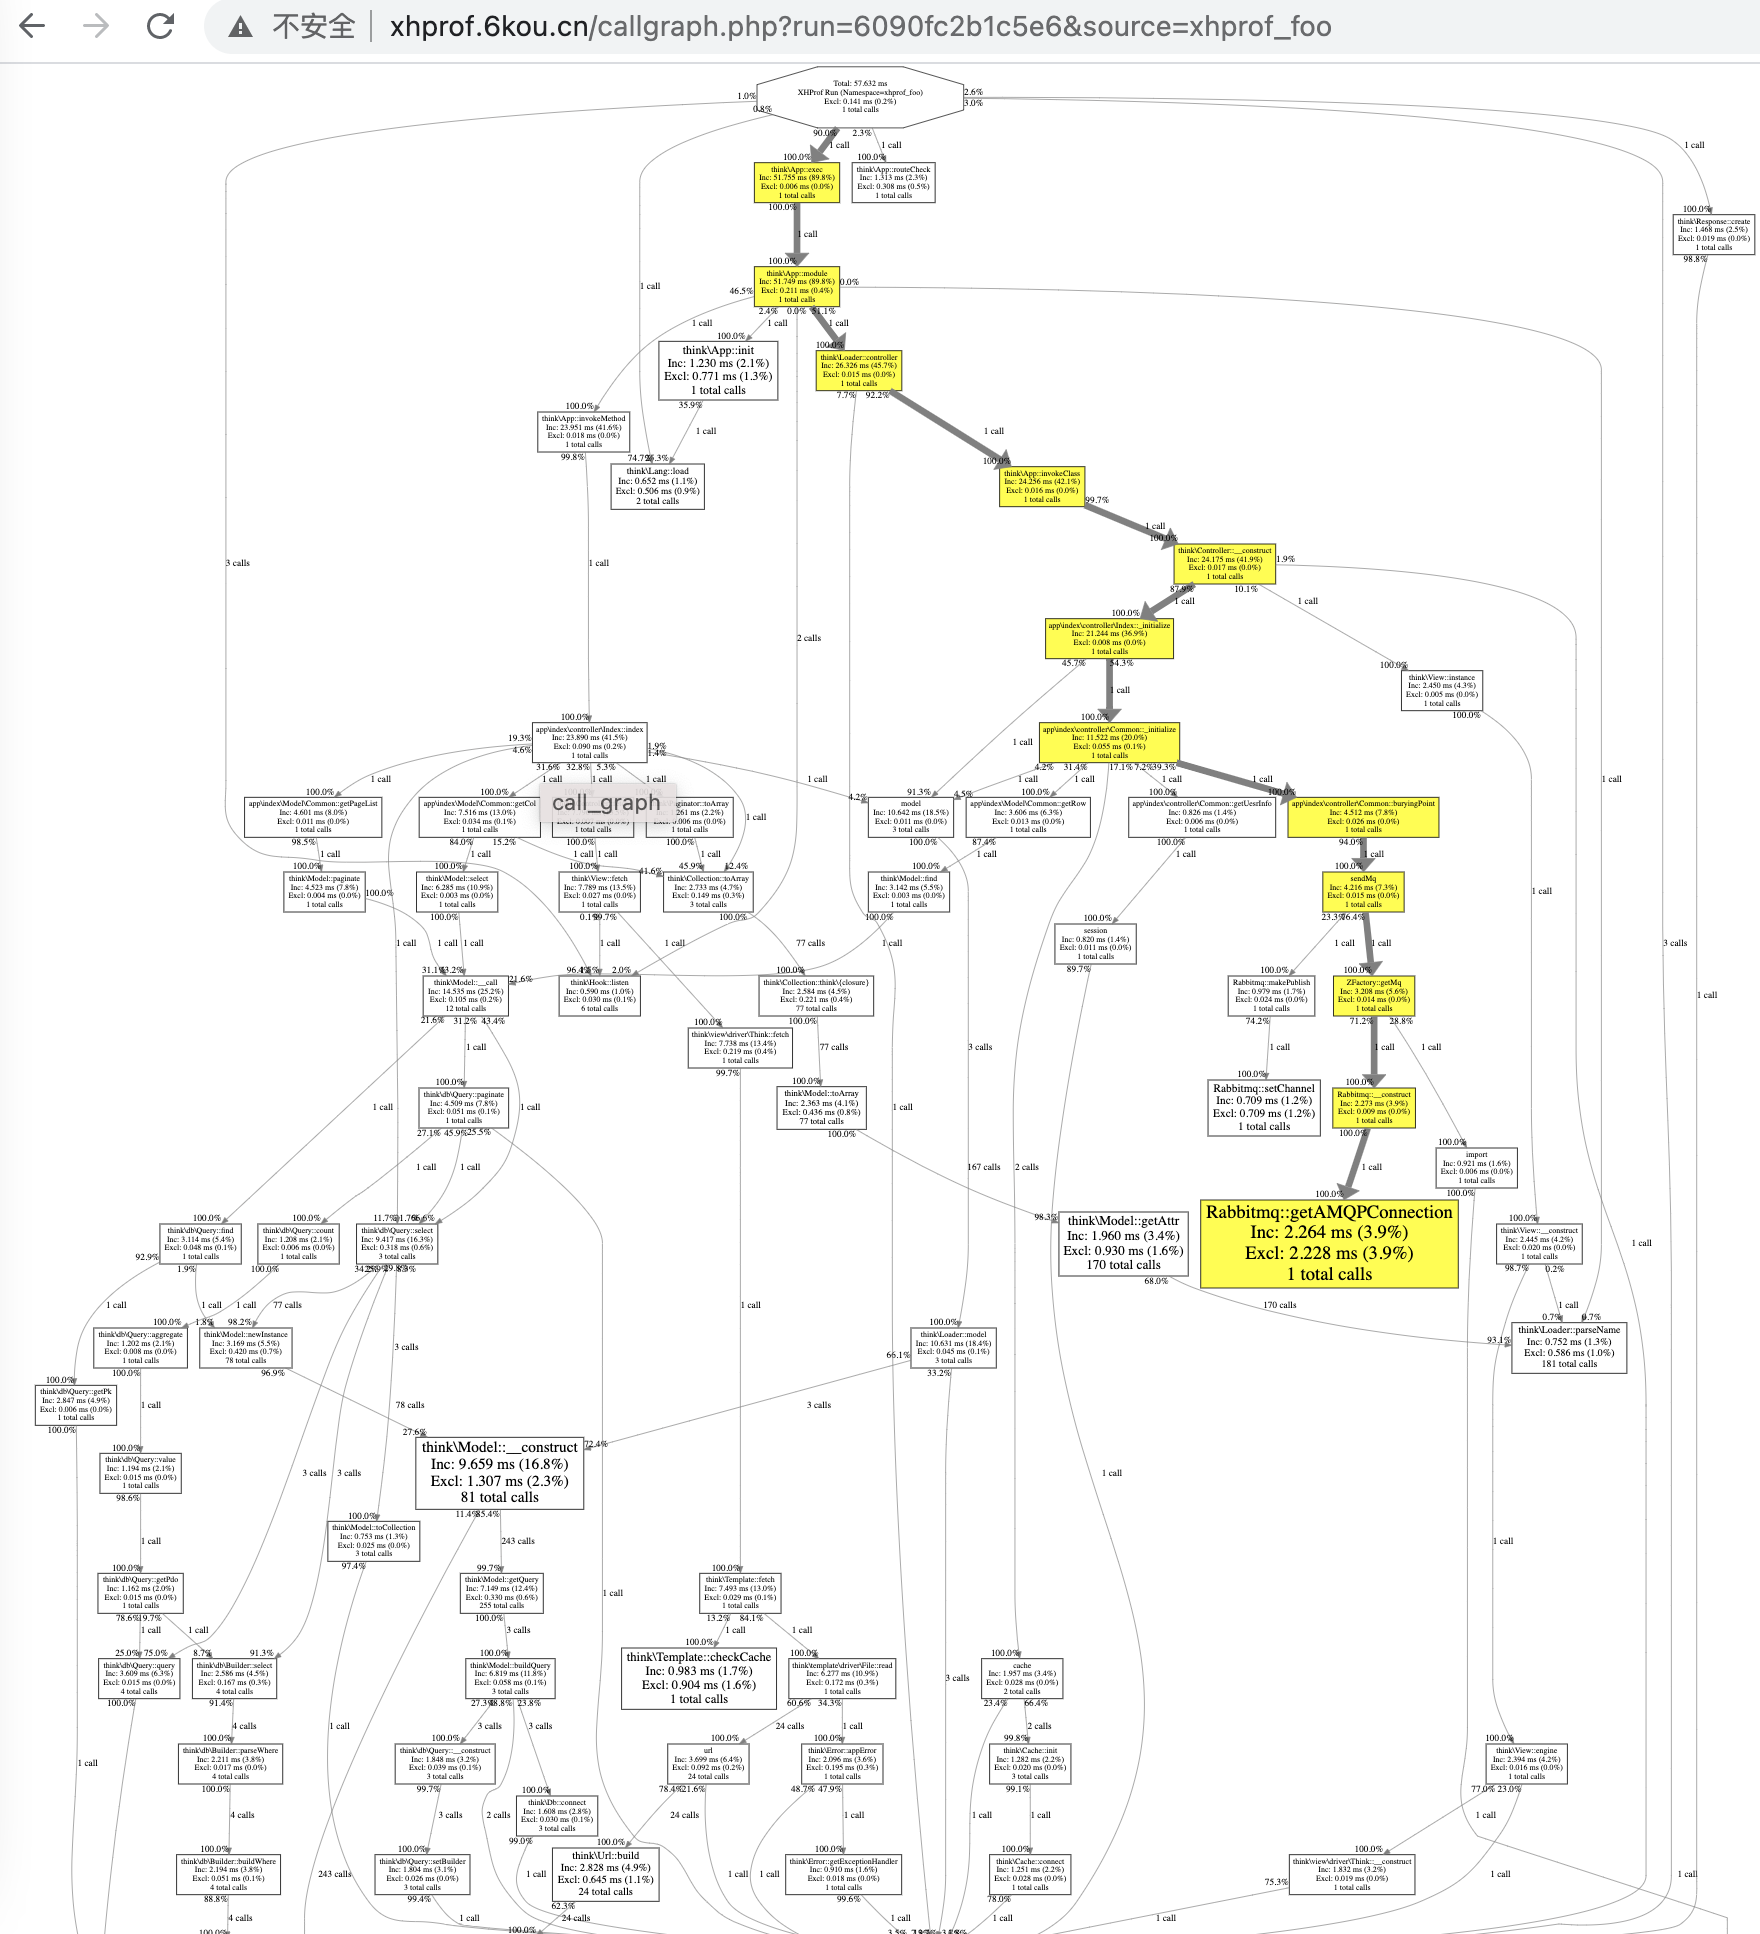
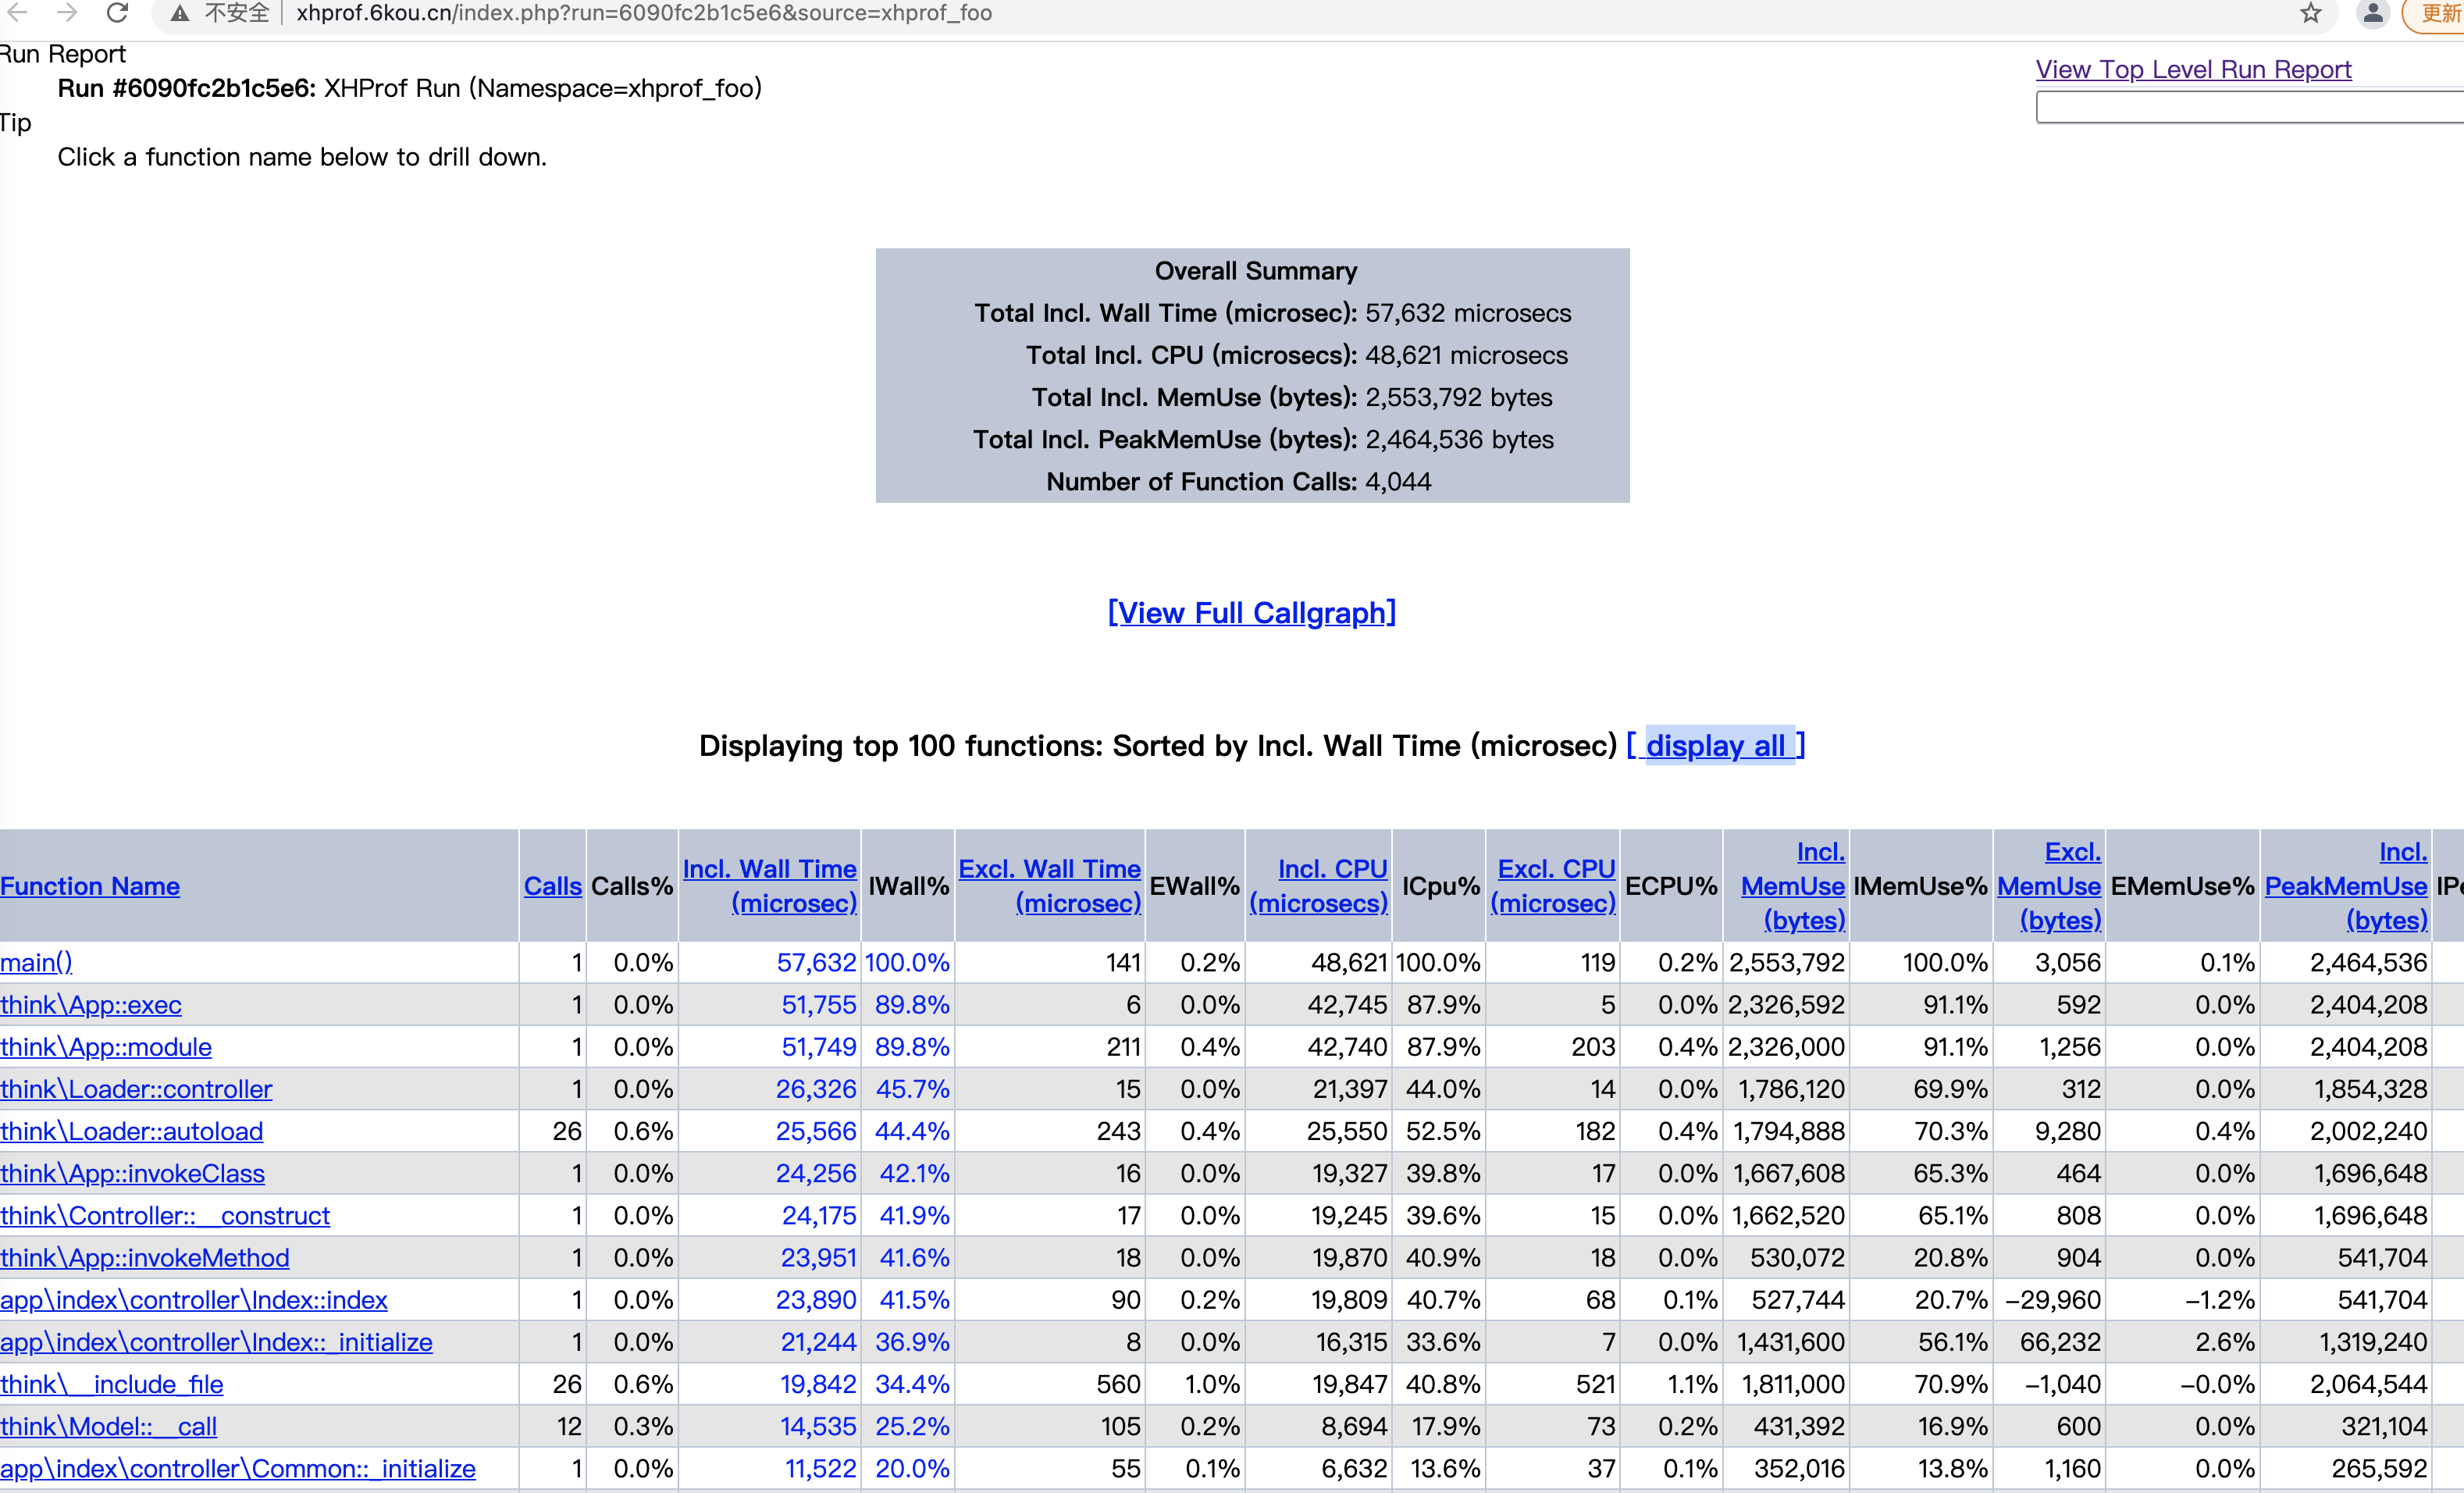
根据图片中的颜色度和箭头你能很方便的看出是哪一处比较占用时间。
注意点:
1、下载的xhprof文件里面的 xhprof_html 和 xhprof_lib 拷贝到项目目录,方便自己引用就好
2、可以新加一个子域名指向到xhprof_html,直接访问域名,是xhprof分析保存列表,链接带上run和source就可以进到对应的分析文件
3、当点击 [View Full Callgraph] 报错 failed to execute cmd "dot - Tsvg"的时候,检查下服务器上的php.ini中disable_functions这项是不是限制了proc_open,因为在xhprof_lib/utils/callgraph_utils.php的xhprof_generate_image_by_dot中使用了proc_open函数
其他
你也可以使用xhprof.io或者xhgui工具来分析你的xhprof结果。
下边是PHP性能分析和PHP性能调优的三篇文章
中文翻译版:
PHP 性能分析第一篇: Xhprof & Xhgui 介绍
PHP 性能分析第二篇: Xhgui In-Depth
PHP 性能分析第三篇: 性能调优实战
英文原版:
Profiling PHP Part 1: Intro to Xhprof & Xhgui
Profiling PHP Part 2: Xhgui In-Depth
Profiling PHP Part 3: Practical Performance Tuning
参看资料
xhprof地址 https://github.com/facebook/xhprof
xhprof手册 http://php.net/xhprof
使用xhprof进行线上PHP性能追踪及分析 http://avnpc.com/pages/profiler-php-performance-online-by-xhprof?utm_source=tuicool&utm_medium=referral
xhprof.io https://github.com/gajus/xhprof.io
xhgui https://github.com/perftools/xhgui
oneapm http://www.oneapm.com/